The chart is telling you more than MACD and RSI. Look at the impulse leg, the failed continuation, the descending ribbon, the volume shift, and the shelf where
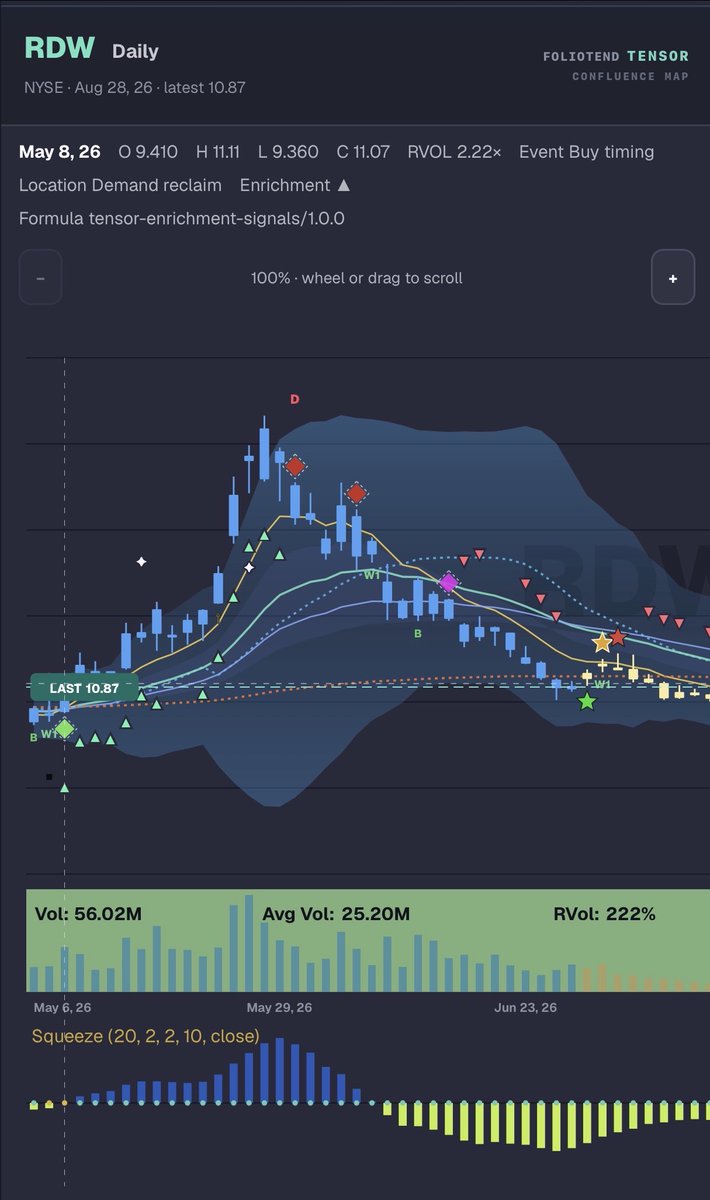
The chart is telling you more than MACD and RSI. Look at the impulse leg, the failed continuation, the descending ribbon, the volume shift, and the shelf where buyers are trying to rebuild.
That is how we read $TSLA and $COIN without getting hypnotized by one indicator. Follow @W0rkerOfSecrets and…
Share this article
📚 More from Billy’s World
Banking With Billy News Network — bankingwithbilly.com
Discord: discord.gg/VHxwmR5j4Y •
YouTube: @BankingWithBilly